[1]:
from common import plot_trajectory
plot_trajectory("trajectories/RuH.xyz");
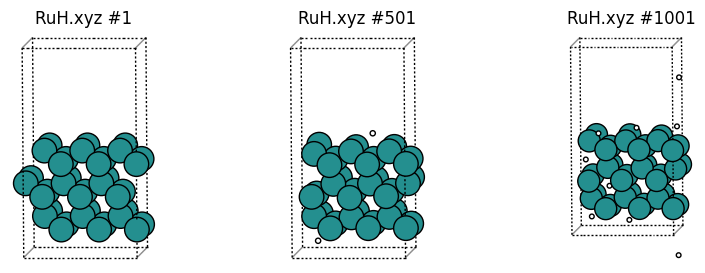
Let’s distinguish atoms based on whether they are H or Ru, and whether their z coordinate is greater or less than 6 angstrom.
Backslashes can be used as on the PrintGroup line to make it clearer which group is printed as which chemical element.
This example illustrates the REGION, where you can use combinations of MinX, MinY, MinZ, MaxX, MaxY, and MaxZ.
If also illustrates INTERSECTION, which takes the intersection of two or more groups.
[2]:
%%sh
cat > cc1.config <<EOF
DumpFile trajectories/RuH.xyz
DumpFileFormat mattixyz
Overwrite
CoutFrequency 200

DefineGroup Z_gt_6 REGION MinZ 6
DefineGroup Z_lt_6 REGION MaxZ 6
DefineGroup Ru ATOMICNUMBER Ru
DefineGroup H ATOMICNUMBER H

DefineGroup H_z_gt_6 INTERSECTION H Z_gt_6
DefineGroup H_z_lt_6 INTERSECTION H Z_lt_6
DefineGroup Ru_z_gt_6 INTERSECTION Ru Z_gt_6
DefineGroup Ru_z_lt_6 INTERSECTION Ru Z_lt_6

PrintGroup All XYZ z6.xyz SPECIAL \
    H_z_gt_6 H \
    H_z_lt_6 Li \
    Ru_z_gt_6 Cu \
    Ru_z_lt_6 Ru

EOF
OMP_NUM_THREADS=1 lionanalysis.exe cc1.config
DumpFile trajectories/RuH.xyz
DumpFileFormat mattixyz
Overwrite
CoutFrequency 200
DefineGroup Z_gt_6 REGION MinZ 6
DefineGroup Z_lt_6 REGION MaxZ 6
DefineGroup Ru ATOMICNUMBER Ru
DefineGroup H ATOMICNUMBER H
DefineGroup H_z_gt_6 INTERSECTION H Z_gt_6
DefineGroup H_z_lt_6 INTERSECTION H Z_lt_6
DefineGroup Ru_z_gt_6 INTERSECTION Ru Z_gt_6
DefineGroup Ru_z_lt_6 INTERSECTION Ru Z_lt_6
PrintGroup All XYZ z6.xyz SPECIAL     H_z_gt_6 H     H_z_lt_6 Li     Ru_z_gt_6 Cu     Ru_z_lt_6 Ru
###########################################################
Running on 1 threads on host .SCMCoffee1
There are 9 groups and 10 actions.
I am lionanalysis version 0.5
Opening dumpfile trajectories/RuH.xyz at byte 0 : 0
      -999       (1) (       0 ps) (5.50747e-05 s) (  0.0877 %)
      -800       (200) (     199 ps) (0.019080162 s) (      19 %)
      -600       (400) (     399 ps) (0.039276123 s) (    39.1 %)
      -400       (600) (     599 ps) (0.05884409 s) (    58.7 %)
      -200       (800) (     799 ps) (0.079301119 s) (      79 %)
         0       (1000) (     999 ps) (0.10025215 s) (    99.9 %)
Closing dumpfile trajectories/RuH.xyz at byte -1
Finished reading dump file... 1001 frames... Writing output....
FIRST TIMESTEP: -999
LAST TIMESTEP: 1
Total time: 0.10046196 s; 0.0001003616 s/timestep
Goodbye!
[3]:
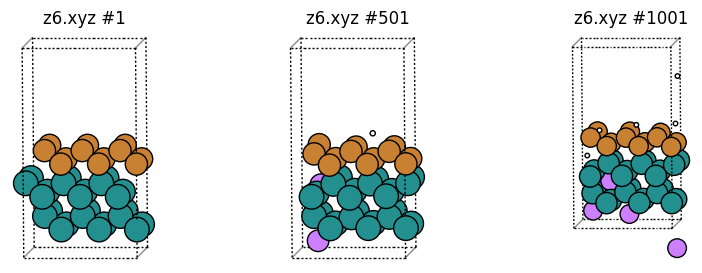
plot_trajectory("z6.xyz");
Number density of particles for an axis
[4]:
%%sh
cat > cc2.config <<EOF
DumpFile trajectories/RuH.xyz
DumpFileFormat mattixyz
Overwrite
CoutFrequency 200

DefineGroup Ru ATOMICNUMBER Ru
DefineGroup H ATOMICNUMBER H

Density Axis z Group H Filename density_h.txt Resolution 0.05
Density Axis z Group Ru Filename density_ru.txt Resolution 0.05
Density Axis z Group All Filename density_all.txt Resolution 0.05
Density Axis z Group H Filename density_h_noperiodic.txt Resolution 0.05 NoPeriodic
EOF
OMP_NUM_THREADS=1 lionanalysis.exe cc2.config  > cc2.out
[5]:
!head density_ru.txt
#xyz raw rawpertimestep distfuncpertstep distfuncpertstepperarea # axis: z group: ru timesteps: 1001 avgarea: 69.3554
0 0 0 0 0
0.05 0 0 0 0
0.1 0 0 0 0
0.15 0 0 0 0
0.2 0 0 0 0
0.25 0 0 0 0
0.3 0 0 0 0
0.35 0 0 0 0
0.4 0 0 0 0
The rawpertimestep contains the average number of atoms in the group per timestep, for that particular z bin:
[6]:
import pandas as pd
def density2df(filename: str) -> pd.DataFrame:
    return pd.read_csv(filename, sep="\s+").iloc[:, :5]

df = density2df("density_ru.txt")
df.plot(x="#xyz", y="rawpertimestep", kind="line");
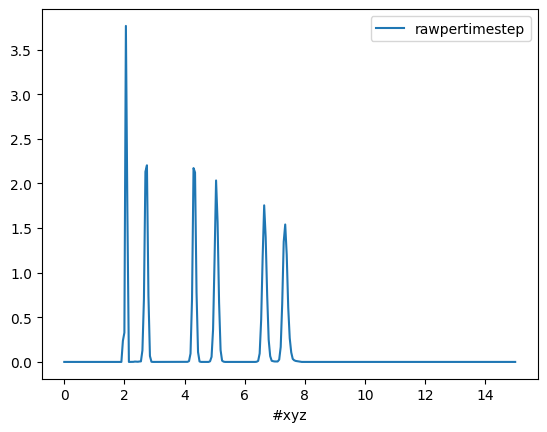
Here, the peak at z = 2 angstrom is higher/sharper than the others, because the bottom layer was thermostatted at a much lower temperature when the MD simulation was run.
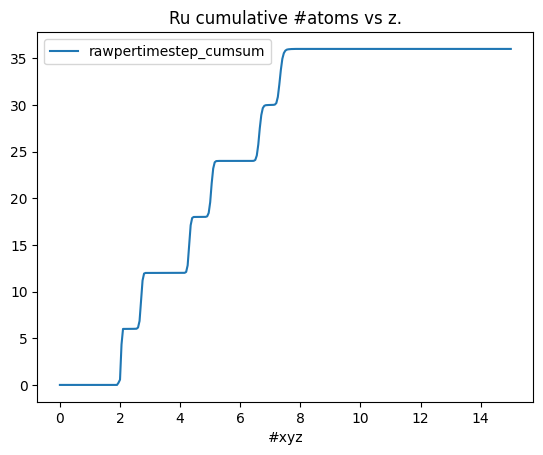
We know that there are 36 Ru atoms for all frames, so the cumulative sum should add up to 36:
[7]:
df["rawpertimestep_cumsum"] = df["rawpertimestep"].cumsum()
df.plot(x="#xyz", y="rawpertimestep_cumsum", kind="line", title="Ru cumulative #atoms vs z.");
However, it is usually more useful to report the number density as opposed to the number of particles. This number depends on both the lateral xy surface area, and the Resolution (that was set to 0.05). It is reported in the distfunctperstepperarea column.
[8]:
df.plot(x="#xyz", y="distfuncpertstepperarea", kind="line", xlabel="z (ang.)", title="Ru atoms number density (particles/ang^3)");
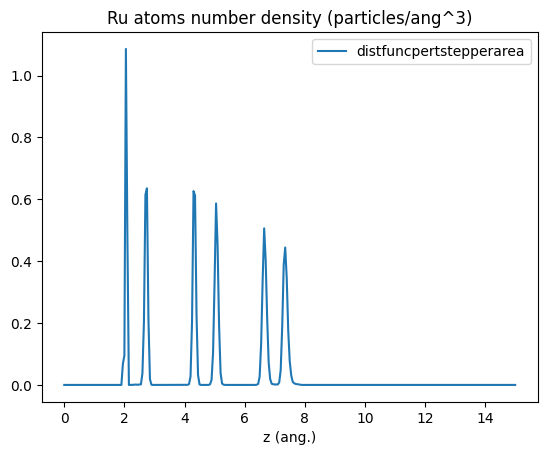
This relation holds:
distfuncpertstepperarea = rawpertimestep / (Resolution * avgarea)
where Resolution = 0.05 angstrom (set in the lionanalysis input file) and avgarea is the average lateral xy surface area in ang^2. It is reported in the top line of density_ru.txt:
[9]:
%%sh
head -n 1 density_ru.txt
#xyz raw rawpertimestep distfuncpertstep distfuncpertstepperarea # axis: z group: ru timesteps: 1001 avgarea: 69.3554
Let’s compare the Ru and H number densities:
[10]:
import matplotlib.pyplot as plt
files = ["density_ru.txt", "density_h.txt"]

fig, ax = plt.subplots()
for f in files:
    density2df(f).plot(x="#xyz", y="distfuncpertstepperarea", xlabel="z (ang.)", ylabel="Number density (particles/ang^3)", ax=ax)

ax.legend(files);
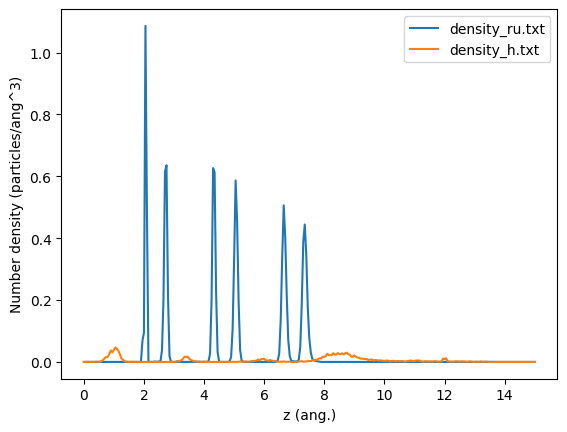
Here we see that H is primarily located on either side of the surface, with small peaks inbetween some of the Ru layers.
Finally, let’s see the effect of the NoPeriodic option. When setting NoPeriodic, the z coordinate is not translated into the main unit cell. In this case, it means that some bins with z <0 or >15 are registered, since the trajectory contains hydrogens with those z coordinates (note: the coordinate cannot deviate more than 10 angstrom from the min/max).
[11]:
fig, ax = plt.subplots()
density2df("density_h_noperiodic.txt").plot(x="#xyz", y="rawpertimestep", ax=ax)
density2df("density_h.txt").plot(x="#xyz", y="rawpertimestep", ax=ax)
ax.legend(["NoPeriodic", "Default"])
ax.set_title("Hydrogen rawpertimestep");
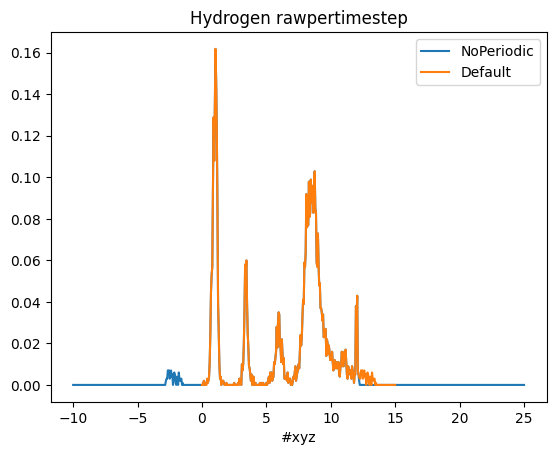
Here we see that the trajectory contains hydrogens with z = -2 ang. (see also frame #1001 at the top of this notebook). But by default the number density will instead by shown at the other end of the unit cell, i.e., at around z=15-2=13 ang.